DIVERSOS E INTERESANTES ARTICULOS EXTERNOS
RELATIVOS AL AREA BASICAMENTE DE LAS FINANZAS
I
Publicado: 2017-06-16
Por: Dennis Falvy
Vicious VIX: Jason Miller Made $53,000, But Larry Tabb Got Bilked
By: The Heisenberg
Summary
- The VIX debate has found its way onto the front page of the Wall Street Journal.
- By way of a series of amusing anecdotes, WSJ explains why it's dangerous for retail investors and even some "pros" to trade volatility via popular VIX ETPs.
- The piece quotes Deutsche Bank's Rocky Fishman, whose analysis I've been highlighting for months.
- Here's an in-depth look at one of the more important issues facing markets today.
"One person's fear is another person's opportunity."
That's from noted market sage, newly-minted futures trader, and 40-year-old Boca Raton day trader Jason Miller, who took some time away from hitting the refresh button on his online brokerage account home page to tell the Wall Street Journal how he's made $53,000 so far this year in short VIX ETPs (NASDAQ:XIV).
As the Journal notes, "that includes a white-knuckle day on May 17, when the VIX spiked 46% following reports that President Donald Trump had pressured former FBI Director James Comey to drop an investigation into former National Security Advisor Michael Flynn."
Miller, undeterred, "rode out the storm, confident the market would revert to its torpid ways - which it did."
The article that features that rather amusing anecdote is called "The Snowballing Power Of The VIX," and you should read it. Because it underscores a point I and many others have been pounding the table on for months: allowing retail investors to short volatility has embedded all kinds of risk in this market.
At issue is the now ubiquitous "doom loop," wherein central bank liquidity artificially suppresses volatility, which in turn allows programmatic/systematic strats like risk parity, CTAs, and volatility control funds to lever up their positions. The concern is that the more suppressed volatility gets, the smaller the nominal spike needed to trigger short covering in VIX ETPs. That short covering could exacerbate said spike, an eventuality which might then force the systematic strats mentioned above to deleverage into a falling market.
Both in these pages, and more extensively over at HR, I've been documenting notes from Deutsche Bank's Rocky Fishman, who writes prolifically about this dynamic. Here's an excerpt from a recent note:
VIX ETPs are a larger-than-usual feedback loop in markets. Inverse and levered VIX ETPs' need to buy VIX futures when vol is rising and sell it when vol is falling creates a feedback loop in vol that can lead to high vol-of-vol. Currently, the combination of low VIX futures levels (making an N-point vol spike look like a huge percentage), large short ETPs, and large levered ETPs leaves over $70mm vega to buy on a hypothetical 5-vol spike in the VIX futures curve.
Unsurprisingly, The Journal piece linked above cites Fishman. Here's the passage:
In a twist, the very funds that are meant to protect against volatility may make any correction worse, says Rocky Fishman, an equity-derivative strategist with Deutsche Bank. So-called "volatility control" funds aim to provide investors with a smoother ride by sidestepping the worst dips. A rising VIX signals the funds to shed stocks in favor of safer assets, accelerating the selloff and spooking other investors into joining the exodus.
Rising volatility triggered $50 billion in stock selling during the market gyrations of August 2015, and $25 billion in the wake of the U.K.'s surprise vote to exit the European Union last year, according to Mr. Fishman.
"It's a feedback loop that can make selloffs unfold faster," says Mr. Fishman.
"There are fund managers whose job it is to sell equities when volatility goes up. And that affects everyone."
I would (strongly) encourage you to read Fishman's analysis in full, as those quotes are just the tip of the proverbial iceberg. As usual, Heisenberg has you covered. Here are two posts where you can read the details:
• Feed Your "VIX-ation" - Rocky's Back To Answer All Your VIX Questions
• Here's The "Not Unthinkable" Nightmare Scenario For Short VIX Strats
The inherent danger in the feedback loop Fishman describes can't be emphasized enough. It was the subject of a recent post I called "Investigating The Market's 'Nightmare Scenario.'"
There's more analysis from the above-mentioned Fishman in that post which finds Rocky noting that while the risk is high that VIX ETPs (NYSEARCA:VXX) could tip the first domino, he suggests the other dominoes might not fall as the situation stands now.
Here's a handy table that illustrates that point (and again, these things change by the day, but this will give you a good idea of what he's talking about):
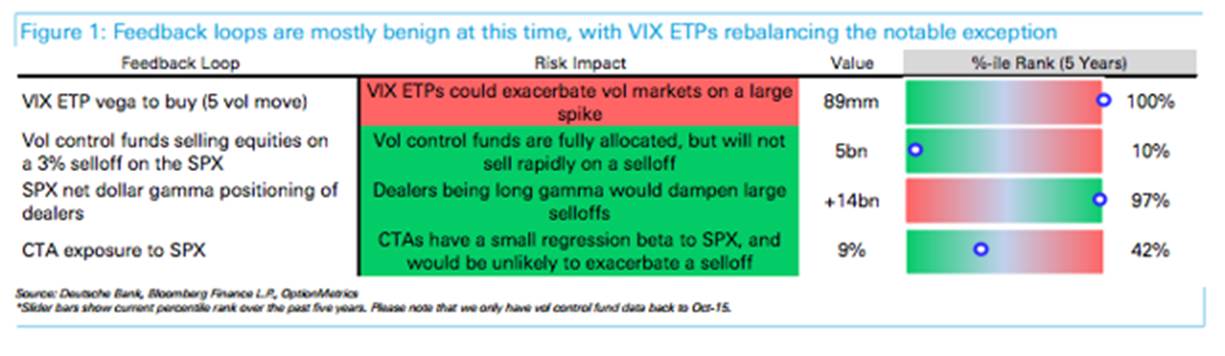
(Deutsche Bank)
The problem (again) is that by perpetuating the "buy-the-dip" mentality, central banks are creating and fostering an environment where the market can't price risk correctly. Simply put, volatility spikes immediately "mean revert". This is something BofAML has been keen on flagging for a couple of months now.
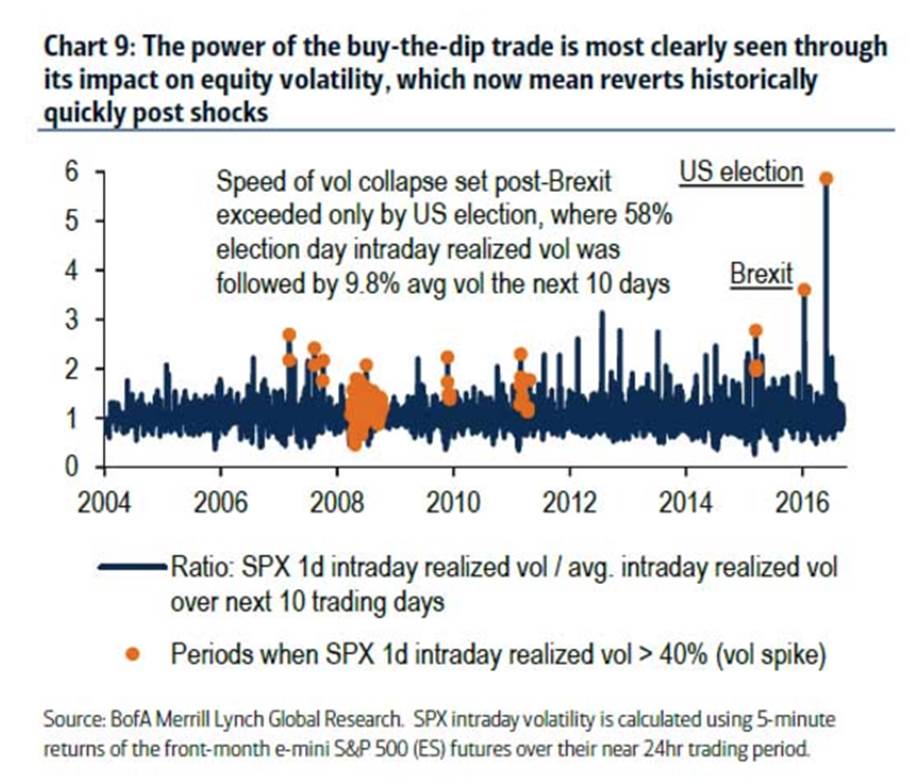
Here's a chart that illustrates the phenomenon in volatility:
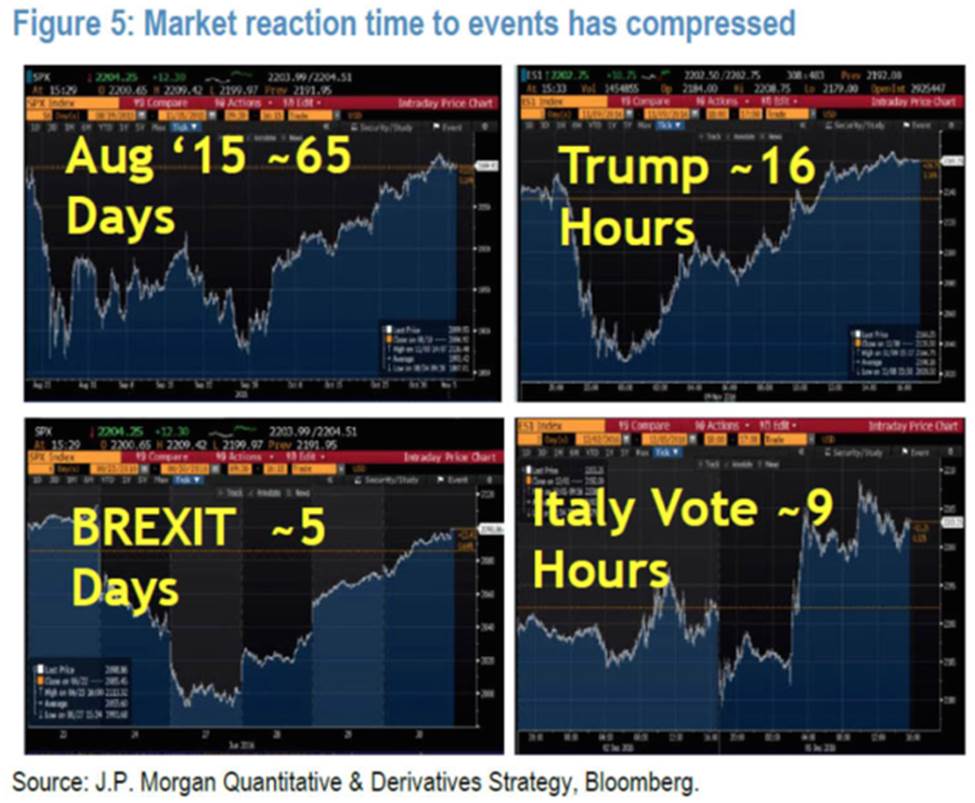
(BofAML)
And here's what it looks like in equities themselves:
(JPMorgan)
That's what's allowed day traders like Jason Miller to clock staggering returns selling volatility via VIX ETPs.
Obviously, the problem here is that the Jason Millers of the world i) would in all likelihood never be doing this if VIX ETPs didn't exist, ii) have no idea the extent to which this trade depends on central banks, and iii) do not know that they are perpetuating an insanely dangerous dynamic by (literally) forcing programmatic strats controlling hundreds of billions of dollars to lever up.
Ultimately, it's not clear that retail investors should be able to employ this strategy. And indeed, it's not even clear that anyone outside of seasoned traders and/or hedge funds has any business doing this. Think I'm exaggerating? Well, consider another excerpt from the Journal's article:
Trading the VIX, however, is a lot different from watching it on TV, and its idiosyncrasies left some investors feeling burned. No trading strategy can exactly replicate the VIX index, and traders rely on proxies like futures and options, which can veer widely from the VIX itself.
VIX exchange-traded products are especially susceptible to this divergence because of the peculiar structure of VIX futures.
Some of the most popular exchange-traded products invest in a combination of this month's VIX futures and next month's. To maintain their exposure, they sell the contracts that are nearing expiration and buy contracts for the following month. Put simply, they buy high and sell low almost every day, steadily bleeding money.
This decay is difficult to comprehend, even for sophisticated investors, and leveraged funds can compound those losses. Market experts say the products are designed for short-term tactical trading, not long-term passive investment.
When the VIX dipped in September, Larry Tabb, president and founder of the Tabb Group, a consulting firm, thought volatility would rise and bought an exchange-traded product that aims to double the daily gain of VIX futures. And even though the VIX rose 28% in October, the VelocityShares Daily 2x VIX Short-Term ETN lost money.
"It just kept going down and down and down," says Mr. Tabb, who blames himself for not reading up on its mechanics before buying. "I got completely screwed."
I don't want to pick on Larry, but read this description from the "About" section of Tabb Group's official website:
TABB Group is the international research and consulting firm focused exclusively on capital markets, founded on the interview-based research methodology developed by Larry Tabb. Since 2003, TABB Group has been helping business leaders gain a truer understanding of financial markets issues to develop actionable roadmaps and approaches to future growth.
Again, not to deride Mr. Tabb, but come on, man. That just further supports my contention that the vast majority of market participants (let alone retail investors) have no business whatsoever pretending to be VIX futures traders.
Remember what you're doing when you sell volatility. Here's Deutsche Bank's Aleksandar Kocic to explain (full note here):
Volatility declines either when the markets are predictable or when there is no consensus. Dissensus has emerged as a new paradigm - an absolute inability to form consensus across variety of contexts, accompanied with an onset of a breakdown of conventional frames of reference. So, what does one do when no decision can be made? Well, one waits.
Selling gamma is an act of abandonment of denial of immediacy. In the same way that issuing debt is equivalent to selling future time (a creditor has an implicit claim on debtor's future), shorting gamma means selling waiting time. Waiting time as an asset is highly undesirable - no one wants to be long waiting time. Short gamma is a way of disposing of it. This means that you can sell something you don't want and get paid for it.
That is a risky trade.
But a combination of central bank liquidity and the mentality (buy-the-dip) that liquidity has instilled in markets has made it seem more like a riskless trade.
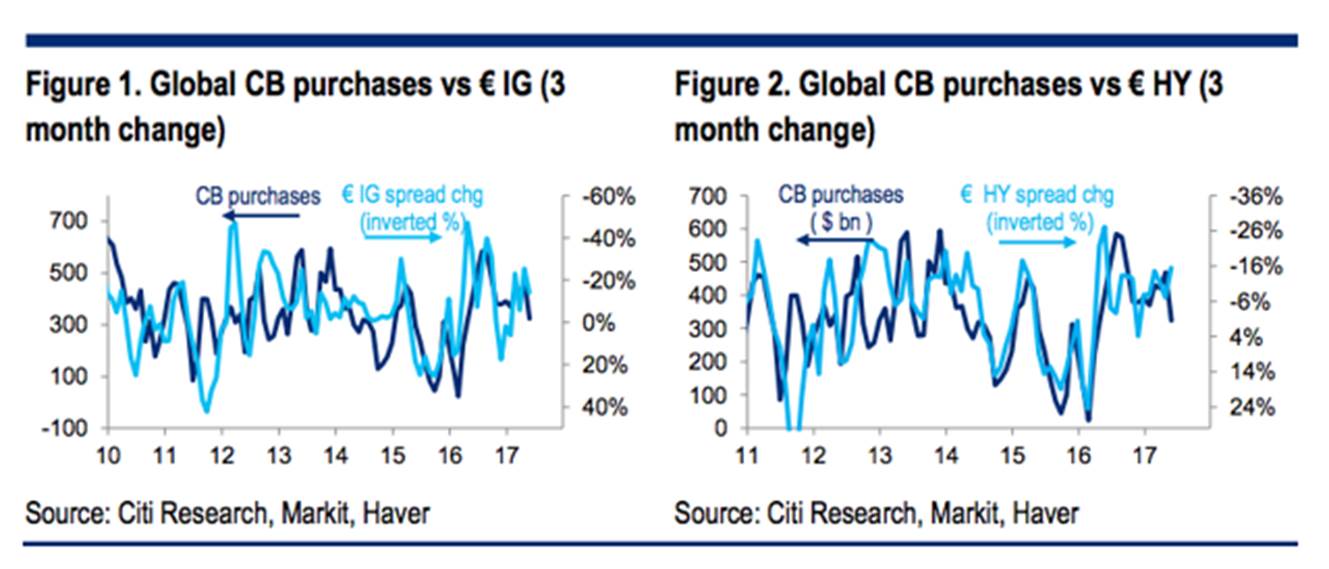
Here's what Citi said late last week with regard to the lack of reaction in European credit spreads following the surprising result of the UK elections:
The common theme remains the remarkable ability of the market to shrug off seemingly any amount of political or economic uncertainty - provided the central banks keep promising to work their magic. As such, to us the spread outlook in both € and £ therefore depends much less on the rather intractable complexities of the political and economic outlook than it does on the minutiae of whether and when central banks remove some of their currently extreme accommodation.
For now, with the punch bowl (or is it a magician's hat?) still full of liquidity, the high opportunity cost of not investing is helping to sustain the status quo. But that doesn't mean that asset prices have actually managed to decouple from central bank balance sheet expansión.
For the last time: the problem is that the vast majority of people selling volatility have no idea that this is what they're betting on and they have even less of an idea about the kind of systemic risks they're creating in markets by participating in the incessant "selling of waiting time" (to quote Deutsche's Kocic again).
Ultimately, I would encourage you to try and understand this for precisely what it is. Because when you do, you'll understand why it is that this discussion has now found its way onto the front page of the Wall Street Journal.
Wall Street's Best Minds
ARE BONDS SIGNALING A PEAK IN STOCK MARKET?
The risks of a stock-crippling recession are rising but the odds of one are still just modest.
By Jeffrey Kleintop
Here are the key points of this article.

• “Dr. Yield Curve” has accurately forecasted recessions and marked the start of bear markets in the past, making the yield curve significant for stock market investors.
• In the U.K., the heightened potential for a recession and bear market reflected in the yield curve is a risk investors in U.K. stocks should consider.
• Outside of the U.K., bond yields and stock prices are generally in agreement that the odds of a global recession are fairly modest.
Historically, when short-term interest rates rise above long term rates, bull markets for stocks have ended and bear markets have begun. In recent months, the difference between short-term and long-term interest rates, called the spread, has narrowed in many countries across the globe. When the spread between these rates turns negative, it is referred to as “inverting the yield curve.”
For instance, stock markets in the U.S. and around the world peaked in 2000 and 2007 when the spread between three-month and 10-year U.S. Treasury yields inverted by about 50 basis points (three-month Treasury yields were about one-half of one percentage point above the yield on the 10-year Treasury note).
[Editor’s Note: The three-month Treasury yield is still more than a percentage point below the 10-year yield, though the spread has narrowed in recent weeks, thanks to a drop in the yield on the longer-term bond.]
Why does an inverted yield curve signal a major peak for the stock market? Every recession in the United States—and accompanying global economic recession over the past 50 years—was preceded by an inverted yield curve.
The yield curve inversion usually takes place about 12 months before the start of the recession, but the lead time ranges from about five to 16 months. The peak in the stock market comes around the time of the yield curve inversion, ahead of the recession and accompanying downturn in corporate profits.
Examining yield curves from around the world, the prognosis on the likelihood of a global recession and bear market is favorable. Like a test showing a patient’s cholesterol is elevated but not yet in the danger zone, yield curves need to be monitored.
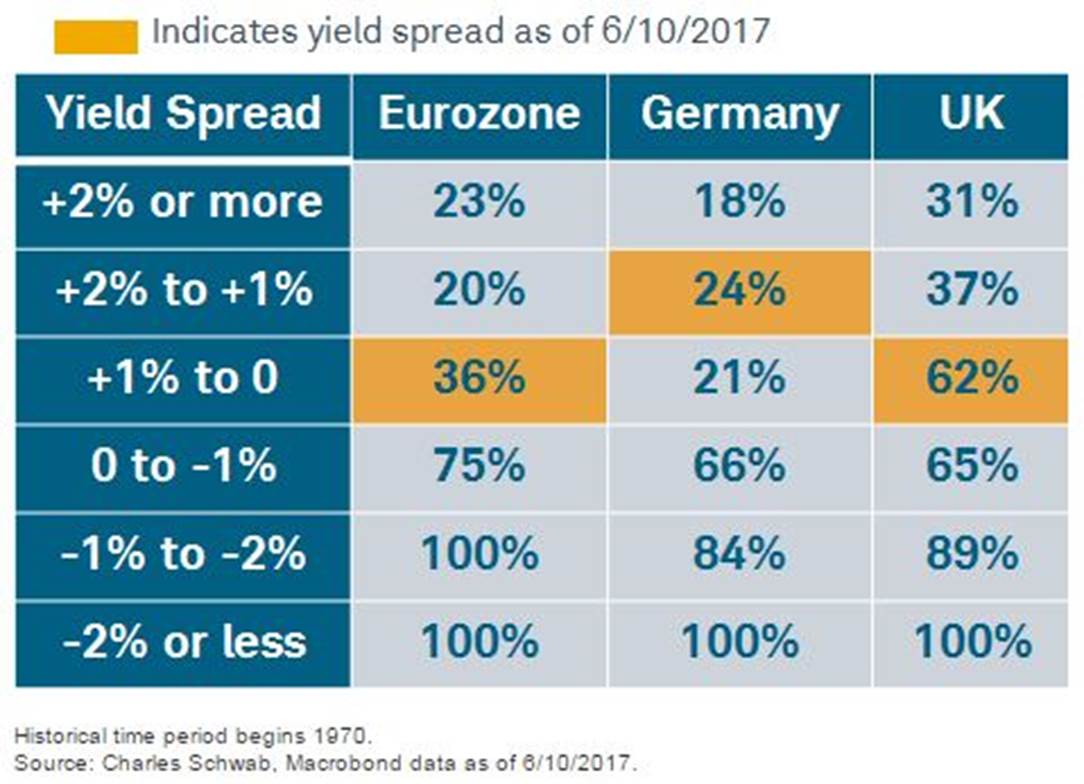
While the risk may be rising, the yield curves indicate that the risk of recession is currently modest—except for the United Kingdom—based on historical evidence, but history doesn’t guarantee future performance.
Last week’s loss by the Conservative party of its majority in the U.K. parliament is unlikely to make Brexit negotiations any easier. Yields may be reflecting the heightened challenges facing the U.K. In fact, the U.K. faces the highest probability of a recession in the coming year of any major country based on the slope of its yield curve and the history of U.K. recessions since 1970.
The spread between short and long-term yields in the U.K. has just slipped into the top of the 0-1% range where the historical probability of a recession in the next 12 months has been 62%, as you can see in the table below of yield spreads and recession probabilities.
EUROPE’S RECESSION OUTLOOK PER THE YIELD CURVE POST-U.K. VOTE
The impact of Brexit is likely to be primarily isolated to the U.K., with minor influences on global stocks. Brexit is likely to have a gradual impact on the U.K. economy due to the long and protracted nature of the negotiating process. The heightened potential for a recession and bear market reflected in the yield curve is a risk investors in U.K. stocks should consider.
Does the flattening yield curve in the bond market run contrary to the rising prices in the stock market? Are there differing diagnoses between bond and stock market investors on the prospects for the global economy? Not in our view. Slipping inflation expectations have been the main reason for the flatter yield curve and lower inflation has not always been a bad thing for stocks.
Outside of the U.K., bond yields and stock prices are generally in agreement that the odds of a global recession are fairly modest.
We can best see the close agreement between the bond and stock market when we look at high yield credit spreads and the stock market volatility. Both are at cycle lows, indicating little risk of a recession priced in the stock or bond market.
At first glance, a slumping yield curve paired with a rising stock market may seem at odds, but it’s clear to us that the message in the stock and bond market is the same: low risk of bear market and recession in the year ahead. However, stock pullbacks are common during bull markets and investors should maintain their long-term asset allocation to help insulate from short-term fluctuations.
Kleintop is chief global investment strategist with Charles Schwab & Co.
SHALE OIL: ANOTHER LAYER OF US POWER
Summary
There’s scarcely a reason to point out how geopolitically important energy is. Energy, particularly oil, is a source of geopolitical power. Every country needs it, but only some countries have the resources to procure it themselves. Some countries have enough of it that they can profit from its export, and others have so much that they rely on it almost exclusively to fuel their economies.
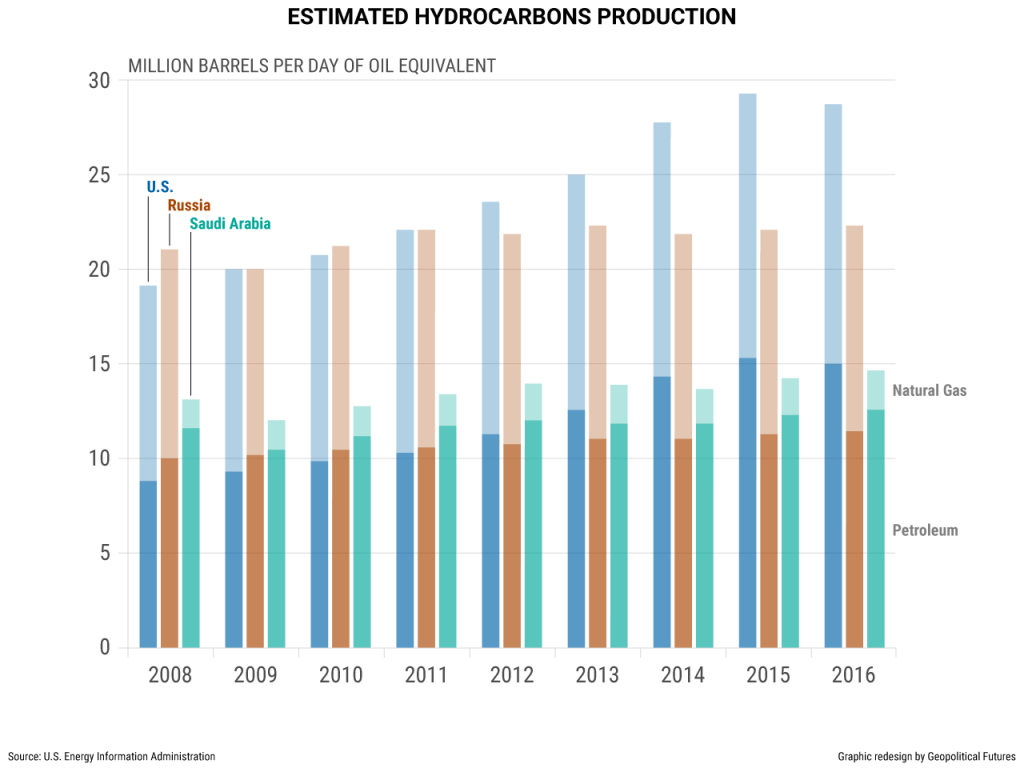
Saudi Arabia and Russia are two such countries. They spend a lot of money on social services, and they can afford to do so as long as oil revenue keeps flowing in. In times of prosperity, they can, through OPEC, bully other countries into doing their bidding and even dictate the direction of markets. But when oil prices are low, as they are now, they simply don’t have as much money to pacify their populations or exert influence abroad. Pressure on their governments builds.
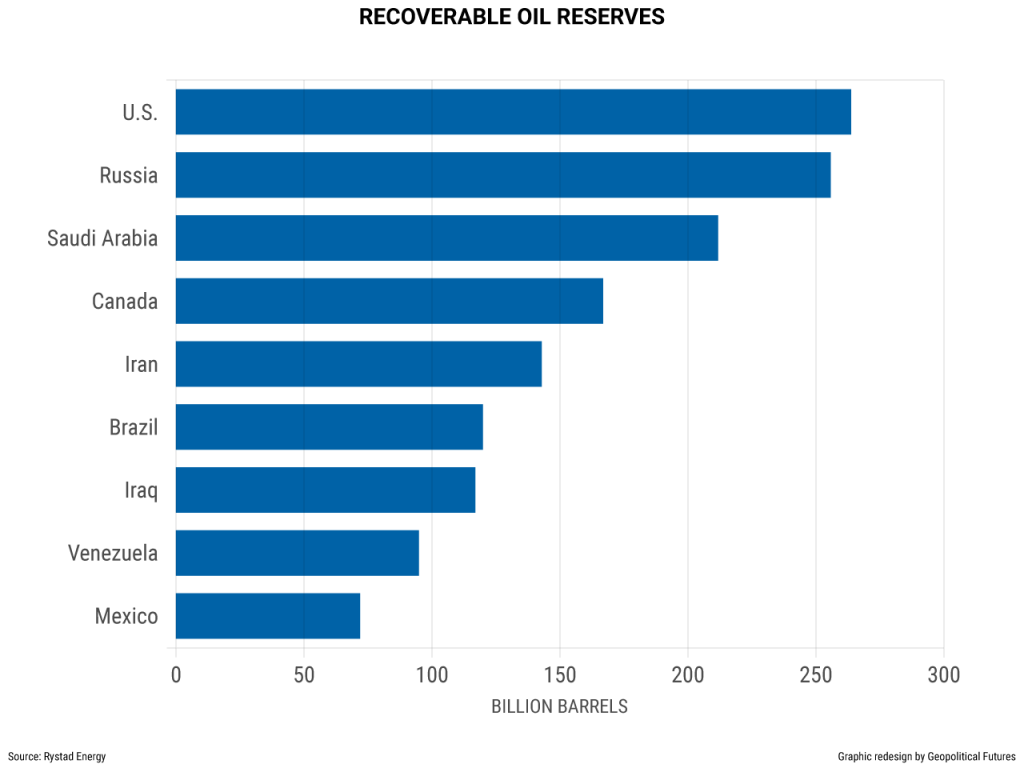
Simple supply and demand helps to explain why prices are low. When prices bottomed out a few years ago, most oil producers, including Saudi Arabia and Russia, were expected to cut production to normalize prices. Instead, they kept production high to increase their market share, thinking (incorrectly) that they would capitalize when prices rebounded. But perhaps a more important reason supply is so high, despite recent efforts by OPEC and Russia to cut production, is that the United States has exceeded expectations on how much oil it could bring to market. With the continued use of hydraulic fracturing and other related technologies, the United States is now believed to have more recoverable oil reserves than any other country in the world, and it is reaping the benefits of its newfound status.
Geopolitical Futures doesn’t forecast commodity prices, so we make no attempt to do so here. But the following report will outline a trend that has emerged over the past several years, one that will maintain downward pressure on prices and thus alter the global geopolitical landscape: affordable shale oil drilling in the United States.
Introduction
Saudi Arabia and Russia are geopolitically important countries. What happens to Saudi Arabia affects the regional balance of the Middle East, and what happens to Russia affects Europe, East Asia and beyond. Their importance is due in no small part to their vast energy reserves, which are their primary source of government revenue. They create a high standard of living to which their populations are accustomed, pay state employees and give the government gravity on the global stage.
Since so much depends on energy, oil prices are more than just financially important. In Saudi Arabia, oil revenue has enabled the government to create patronage networks public and private alike. It has also enabled Riyadh to be the de facto leader of the Middle East. Without oil revenue, the government could not fund its Sunni Arab proxy groups in the battle for regional control, finance the war in Yemen or even maintain social stability.
The story is much the same in Russia. Financial reserves have dwindled. Russia is considering cutting defense spending in the coming years (something it rarely does) and is struggling to finance state pensions. Now that its Reserve Fund is being depleted, Moscow will have to switch over to its National Wealth Fund, which has a little over $70 billion but which is, for various reasons, much more difficult to tap into.
OPEC, which Saudi Arabia essentially leads, has so much recoverable oil that it has been able to more or less control oil prices by adjusting production levels, sometimes in concert with Russia. But that is no longer the case. By some estimates, the United States has surpassed Saudi Arabia in recoverable oil reserves as advancements in hydraulic fracturing and horizontal drilling have enabled producers to access areas previously not thought posible.
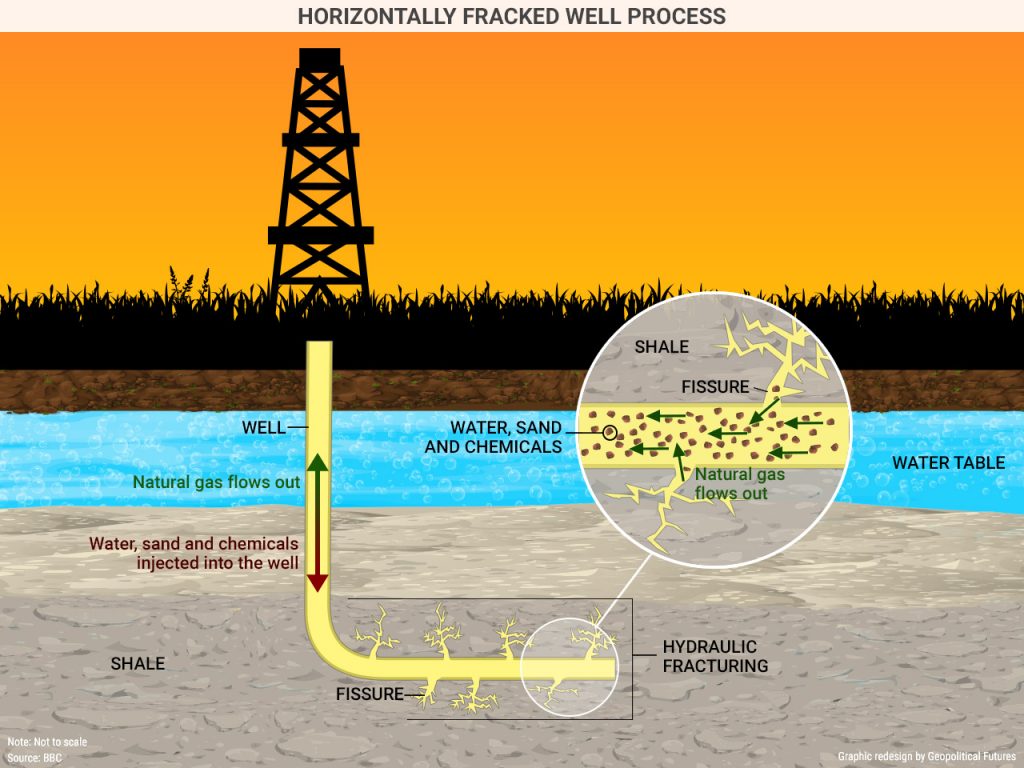
A DEEP HISTORY
Hydraulic fracturing, more commonly referred to as fracking, is a process by which oil deposits found in shale rock formations are extracted. Shale oil, also called tight oil, is enmeshed in shale rock, which is located thousands of feet beneath the Earth’s surface and is generally less permeable than other rock types, making deposits more difficult to access – difficult, but not impossible. Once producers drill down far enough to reach the shale deposits, they inject a solution made mostly of water (hence hydraulic) at high speeds to break apart the rock (hence fracturing), creating fissures through which oil can flow. Included in the solution are certain chemicals that assist in the extraction process and a kind of sand that keeps the fissures open once the fracturing is complete. (The process can also be used for natural gas, and its effect on natural gas prices is similar, but for the purposes of this report we will focus on oil.)
Though fracking has become more of a household term in recent years, it’s hardly a new technology. It dates back to the mid-19th century, when a man named Col. Edward Roberts devised a way to lower an explosive device through a pipe in an oil well that had already been drilled. Some of the wells in which this technique was used were thereafter 1,000 percent more productive (that’s not a typo).
Roberts’ explosive device was eventually replaced by another explosive, nitroglycerine. Even though nitroglycerine was used as late as the 1990s, companies began to experiment with using more inert materials as early as the 1930s. In 1949, Halliburton became the first company to fracture a well with wáter.
It was also in the 1990s that producers began to combine fracking with a separate process known as horizontal drilling, which allows a well to be drilled vertically, then, when the drill hits the desired sedimentary layer, it is turned to drill parallel to the layer. In 1991, a well was successfully horizontally drilled and fractured for the first time, and in 1998 the first profitable horizontally fractured well was completed. The supply of U.S. shale gas, and later shale oil, has increased ever since.
The United States has benefited from the shale revolution more than any other country. Not only does it have extensive shale formations, but most of its wells are located entirely within its territory, so producers don’t have to compete for jurisdiction or share their profits. (Brazil and Paraguay, for example, have overlapping oil interests that have sparked debate over ownership and sovereignty.) Still, the shale revolution is not exclusively American. Canada has some shale plays in operation, and from 2020 to 2040, Russia and Argentina are expected to tap into their shale oil reserves.
In the meantime, the United States is likely to become a net energy exporter in 2017, according to some estimates from the U.S. Energy Information Administration. This is no small development; energy independence has been a strategic objective of Washington’s for some time. Shale oil has given it the means to achieve its goal.
Peculiar Economics
Energy independence, however, depends on the peculiar economics of the shale industry. Drilling for shale oil costs less per project than, say, deep-water drilling. There are two general types of costs: capital costs and operating costs. Capital costs are the investment required to drill and complete the well and build the facilities onsite to manage it. Operating costs are the ongoing costs after the well has been drilled. These are measured either in dollar per thousand cubic feet or in dollar per barrel.
The total well cost – the entire amount of investment required to set up a new well, including land, permits, drilling and completion – varies by location but runs consistently in the low millions of dollars. A report by the EIA estimated that the average completion cost per well is around $5 million to $9 million, depending on the location of the deposits. Some companies, however, are able to drill and complete wells much more cheaply; Chesapeake Energy was able to complete wells in the Mississippi Lime in northern Oklahoma for $2.8 million per well in 2015.
According to the EIA, drilling accounts for 30-40 percent of all capital costs. Completion costs, which include the actual fracking process, account for 55-70 percent. Facilities costs, which include erecting onsite buildings as well as road construction to transport oil away from the site, account for 7-8 percent of well costs.
The same EIA report analyzed well completion costs across a number of companies and locations and determined that average costs, in terms of dollar per barrel of oil equivalent – an approximation of energy released by burning one barrel of oil – declined 7-22 percent from 2014 to 2015 and 25-30 percent from 2012 to 2015.
Importantly, some wells are drilled but not completed when funds dry up or when oil prices dictate that the well is no longer economically viable for the time being. In this scenario, the oil driller has effectively used the low permeability of the sedimentary layer to store oil until IT’S READY TO FRACK THE DEPOSITS.
Once the oil starts to flow, operating costs tend to vary. Gathering, processing and transporting can range from $2.25 to $5 per barrel for oil or higher, depending on how far it needs to be transported. Water disposal can range from $1 to $8 per barrel. Other general and administrative expenses range from $1 to $4 per barrel.
New drilling techniques can expedite the completion process and thus drive costs down further. Several years ago, a new well might have taken 3-4 weeks to drill. Now it can take as few as 7-10 days. Not only does this cut down on the overall costs of producing a barrel of oil, it also gives producers flexibility to respond to higher prices and to expand their operations. In fact, now that so many shale plays are known to produce, exploration is less risky, so companies are more willing to operate there.
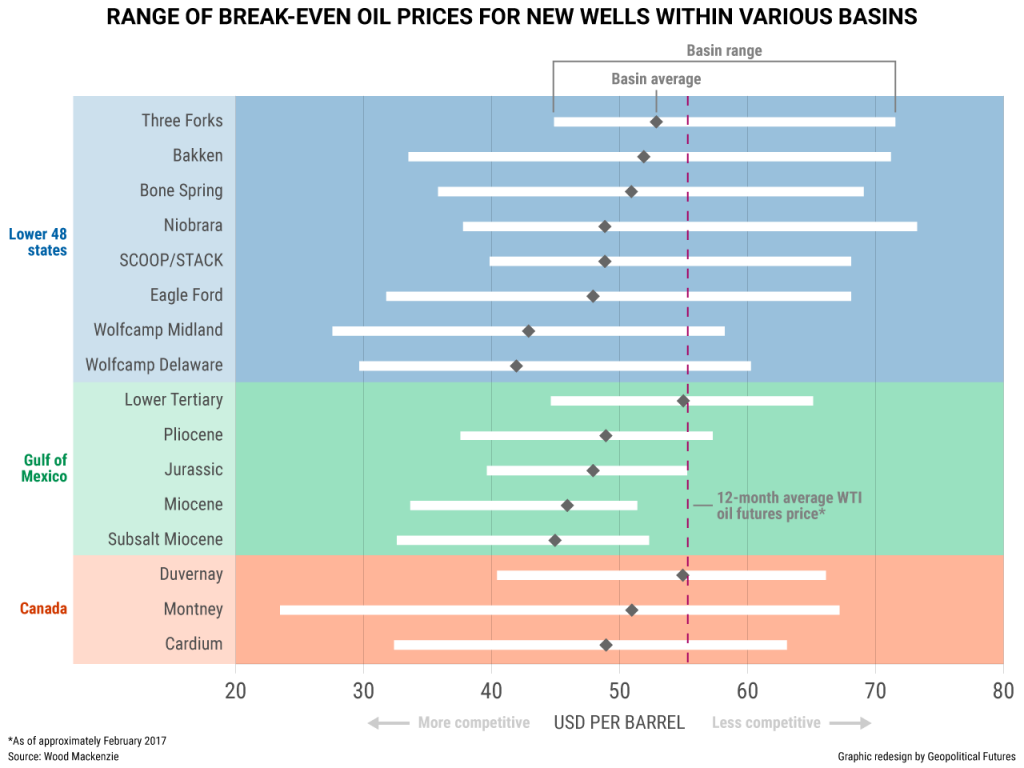
Since capital and operating costs are so varied, there is no single break-even price for shale oil. But if we average wells by location, we can get a sense of which prices generate profit and which do not.
Wood Mackenzie, an energy research and consulting firm, estimates that 60 percent of all crude reserves that are economically viable at $60 per barrel or less are located in U.S. shale reserves. This figure is different for every well, of course – some are unprofitable even at $46.88 – but it is notably lower than the break-even price just a few years ago, around $80-$100 per barrel.
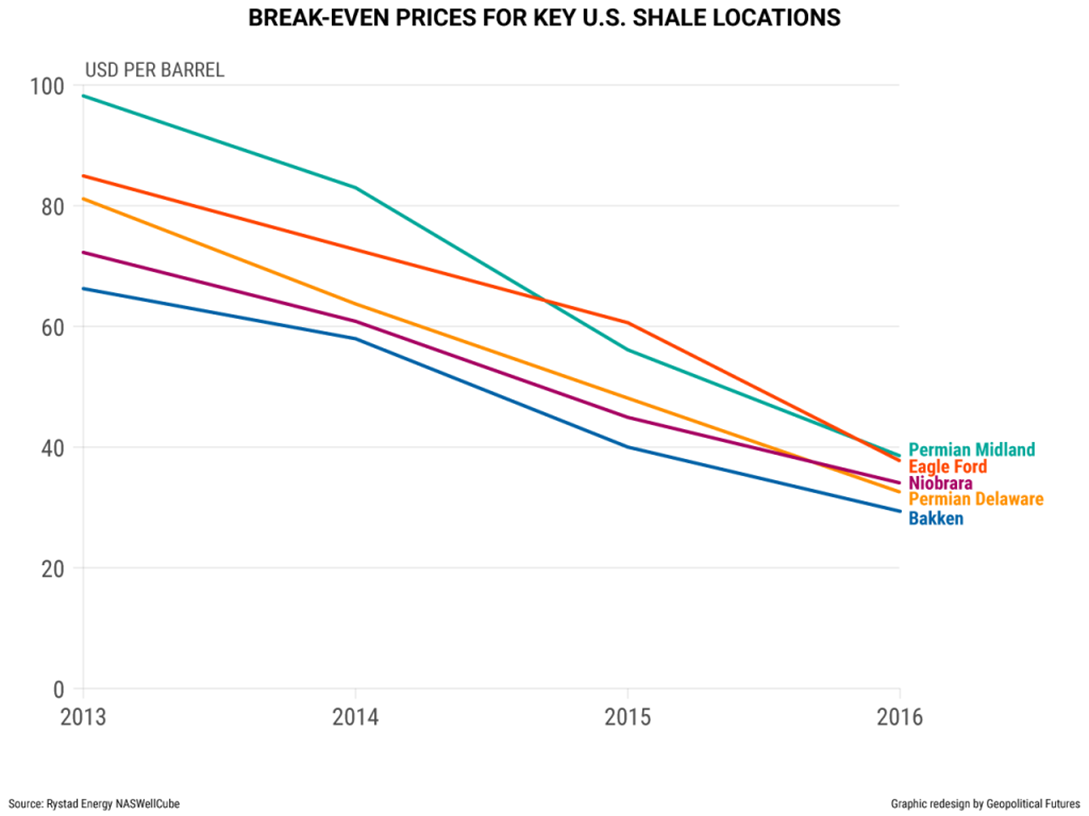
In fact, break-even prices are down at most shale locations. This is partly because of lower costs and partly because of higher yield enabled by newer technologies. And while total rig count has declined significantly, production has remained stable.
OIL WELL
What complicates things is that technological innovation raised some absolute costs of drilling even as it yielded more oil from wells. Consider fracking sand. Producers eventually figured out that if they injected the wells with a hydraulic solution that contained more sand than the previous solutions did, their wells yielded more oil. The solution was then adopted throughout the industry. This increased the demand and therefore the price for sand.
The price of labor has risen too. When oil prices declined from mid-2014 to early 2016, many shale sites were left uncompleted and their crews laid off. When prices rebounded to the $40-$50 range, as many as 400,000 workers returned to complete the wells. But since the demand for labor was widespread, companies were forced to offer more competitive wages to attract skilled personnel back to their sites.
And then there are the vendors who provide goods to drilling companies. When prices bottomed out in 2015, vendors sold their wares at low margins – the only way companies could afford them. If the price of oil rises in the next 1-3 years, vendors will raise their prices in kind, knowing that their customers can foot the bill. These short-term gains, however, will be modest at best. Some analysts believe the inflation rate of input costs could reach 10-20 percent.
Drilling companies also have to pay for the land on which they operate. Some of the richer shale territories such as the Permian Basin charge a high price because they are in such high demand. The Trump administration has pledged to make it easier for companies to drill for oil, and if that is the case, it’s reasonable to assume there may be more land available for shale exploration in the future.
Costly though these factors may be, they are ultimately short-term risks for energy companies. The industry would continue to innovate even if, all things equal, oil prices increased. In fact, wells have been pretty productive independently of price trends. Higher prices will keep the drillers drilling until oversupply drives prices down again.
NO REASON NOT TO
And therein lie the geopolitical consequences of the shale revolution. In Russia and Saudi Arabia, it’s still much cheaper to drill for conventional oil than for shale oil. Each can produce a barrel for about $10-$15. With oil priced at $50, the government in Riyadh will make more money off a single barrel than a shale oil driller will for the foreseeable future. This explains why, even when prices fell so dramatically from 2014 to 2016, OPEC could afford to maintain high levels of production. Its members (and Russia) thought that if they kept prices low and captured market share, they could outlast U.S. shale producers who could, in theory, no longer afford to operate.
It was a sensible strategy at the time. The problem is it didn’t work. OPEC didn’t expect shale oil drillers to lower their costs as much as they did, nor did it anticipate how quickly they could complete unfinished projects. A shale oil driller in the United States, moreover, doesn’t need to be more profitable than Saudi Arabia to drill new wells; the driller just needs to fetch a sufficient return on invested capital. When prices are low, drillers simply forgo exploration and concentrate on the completed wells that produce enough oil to justify their existence.
US SHALE
The number of drilled but incomplete wells has grown over the past few months.
When oil prices reach the upper end of the $40-$60 per barrel range, these wells will begin to produce, bringing even more oil onto the market. This is a foreboding prospect for countries like Saudi Arabia and Russia that depend so heavily on hydrocarbons. Sure, they can produce oil more cheaply than their U.S. counterparts, but rampant government expenditures make their fiscal break-even point – the price at which their budget is not running a deficit – much higher. The International Monetary Fund estimates that oil will need to cost $78-$80 per barrel in the next two years for the government in Riyadh to break even on its fiscal budget. Russia’s break-even point is lower at $68 per barrel, but it’s still higher than current prices. Short of that, the two countries will have to run budget deficits – which deplete their fiscal reserves – to continue the social spending programs that earn them the support of their people.
DRILLED
For Russia, that means cutting state pension plans on which more than 90 percent of its citizens depend for their retirement. For Saudi Arabia, that means cutting benefits for state employees who have grown accustomed to a comfortable lifestyle. It is in both cases a recipe for social discontent – something both governments are keenly aware of.
U.S. shale producers, meanwhile, are now profitable at levels below the fiscal break-even points of Russia and Saudi Arabia. They have no reason not to drill more. So even if prices climb high enough for Riyadh and Moscow to break even, it is unlikely that they will stay there for long, since high prices encourage shale producers to drill more.
In light of this dynamic, the United States is uniquely positioned to be energy independent – or at least less dependent on oil imports – something it has wanted to be for decades. Contemporary U.S. power is built on two layers: its military might and its relative independence on exports at a time of stagnant global demand. Energy independence would give it a third layer, making it only more powerful. The agility of its oil sector to respond to market forces is simply more than Russia and Saudi Arabia can bring to bear.
CONCLUSION
OPEC’s strategy – gaining market share to put shale drillers out of business – has failed. Shale oil producers have proved capable of reducing their per barrel costs and competing on the global market at price points that would have been unimaginable just a few years ago. If OPEC (or Russia) raised prices by cutting production, they would make shale producers only more profitable. If they kept prices low by raising production, they would only spur more innovation by shale oil producers.
Geopolitics is rarely a zero-sum game. But in the case of shale oil, what’s good for the U.S. is bad for its rivals.
THE DECEPTION OF OBVIOUS FACTS
by: StockResearch.net
Summary
- Volatility selling, leverage, and why the recent past doesn't predict the future.
- Friday's Facebook, Amazon, Apple, Microsoft, and Google sell-off is a preview of the future.
- If you think investment grade and high yield bonds balance your portfolio, think again.
MILLER'S MARKET MUSINGS
Clear. Focused. Timely.
First, apologies for skipping an edition of the Musings. Life has been hectic, with traveling to visit company management teams. And really, there wasn't a lot to say - markets have been calm and quiet lately. If you don't have anything important to say…you know the rest.
"There is nothing more deceptive than an obvious fact." - Arthur Conan Doyle, The Boscombe Valley Mystery
There are some obvious facts about the U.S. stock market that are fairly deceptive. Maybe the most deceptive of them is that recent low volatility does not portend future low volatility - in other words, if the recent past has been calm, the near future may not also be calm. And yet, that is precisely what multiple market indicators of future volatility are pricing in. What is deceptive about this market is that while the overall S&P 500 continues to move in a very narrow, low-vol range, the underlying sectors are swirling around fairly rapidly. This is leading funds and strategies that aspire to control the volatility of their own returns to become overly comfortable with the market. If these strategies were small relative to the size of the stock market, it really wouldn't matter. But according to the Wall Street Journal, "volatility control" funds that use the VIX to decide whether or not to buy stocks now have $200 billion in assets.
That is in addition to the trend following strategies being used by pension funds and risk-parity funds that increase their leverage during periods of expected low volatility.
"'Is there any point to which you would wish to draw my attention?'
'To the curious incident of the dog in the night-time.'
'The dog did nothing in the night-time.'
'That was the curious incident,' remarked Sherlock Holmes." - Arthur Conan Doyle, Silver Blaze
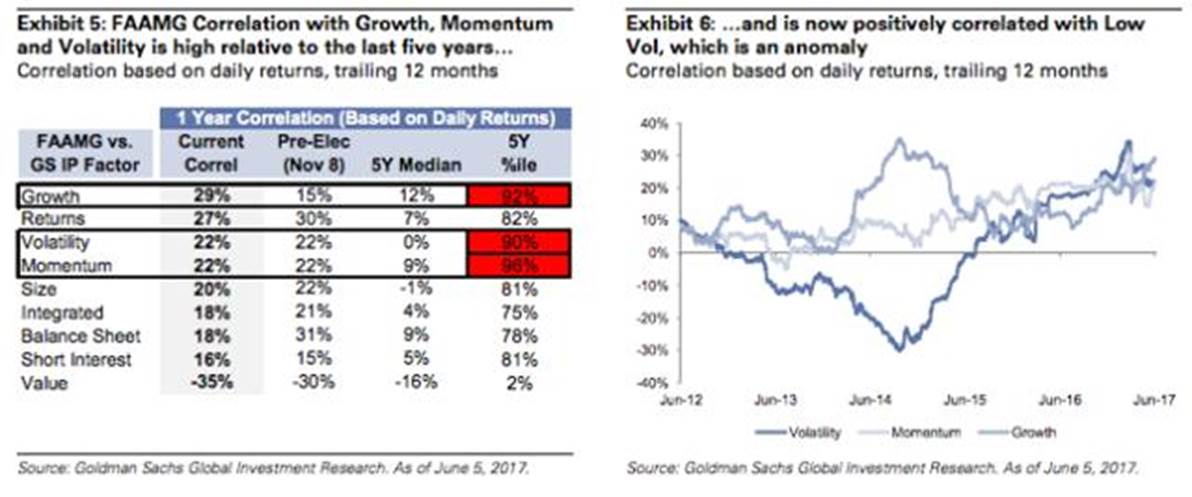
This crowding into the low-vol trade will only be problematic when volatility spikes and remains high for a significant period of time (i.e., more than a few days). When will that happen? I have no idea. The sell-off in the ever-evolving cohort of FANG/FAAMG (Facebook (NASDAQ:FB), Amazon (NASDAQ:AMZN), Netflix (NASDAQ:NFLX), and Google (NASDAQ:GOOG) (NASDAQ:GOOGL), or Facebook, Amazon, Apple (NASDAQ:AAPL), Microsoft (NASDAQ:MSFT), and Google, depending on who is using the acronym) on Friday was sharp and, relative to recent trading, deep. But a rally in financial and energy stocks, which have been the two worst performing sectors year to date in the SPX, offset the tech declines - keeping overall SPX vol low. So, the low-vol trade continues to work, until it doesn't.
Put another way, the dog did nothing in the night time, which is a curious thing.
DECISION 1
The concern I have is that when the low-vol trade eventually doesn't work, it's going to blow up spectacularly, as, compared to past market downturns, there is a lot of money betting on stability. What that means is that, past a certain point, the selloff will accelerate, as put sellers either hedge or get margin calls. Some would argue that the recent surge in "passive" investing via index funds and ETFs will acerbate that eventual selloff, but I'm not so sure - we have had spectacular crashes in the past, well before Vanguard created an index fund. What may be different this time is the speed with which it occurs - think Black Monday, 1987, not the relatively more gradual declines of 2000.
So, why am I so sure that eventually we'll have a severe decline? Mainly because there aren't many cheap stocks anymore. Value investors (and I think of myself as one of those) prefer to invest when the math on an IRR basis is easy, and right now, that math is hard to make work.
At current prices, value investors are having a difficult time finding stocks that they feel confident in buying and holding. Many value mutual fund managers I talk to are just putting money to work because they have to, not because they want to. Growth has massively outperformed value recently, exacerbating the relative performance problem and driving the aforementioned FAAMG cohort to spectacular year-to-date returns. Unfortunately, what this means is that in a sell-off, value investors aren't going to be interested until stocks fall a large amount. When stocks are cheap, value investors are in there picking away at their favorites and are probably getting money flows to boot if they have recently had good performance (which they tend to do when stocks are cheap). But in the current market, stocks aren't cheap, value funds are bleeding cash, and the funds that invest using momentum factors and other trend following systems will all get sell signals at the same time - creating a self-reinforcing negative feedback loop. The market may well then become reflexive, where stocks going down makes them less attractive to the investors that have been getting money, while the investors that normally step in as prices go lower are already fully invested or don't have the firepower to stem a decline. The flow of funds out of active managers and into passive investments is one risk factor that will create this negative feedback loop (index funds don't hold cash, for example), while the amount of money in "vol control" and vol selling strategies is another. The combination could create some breathtakingly fast declines. Buckle up.
"How often have I said to you that when you have eliminated the impossible, whatever remains, however improbable, must be the truth?" - Arthur Conan Doyle, The Sign of Four
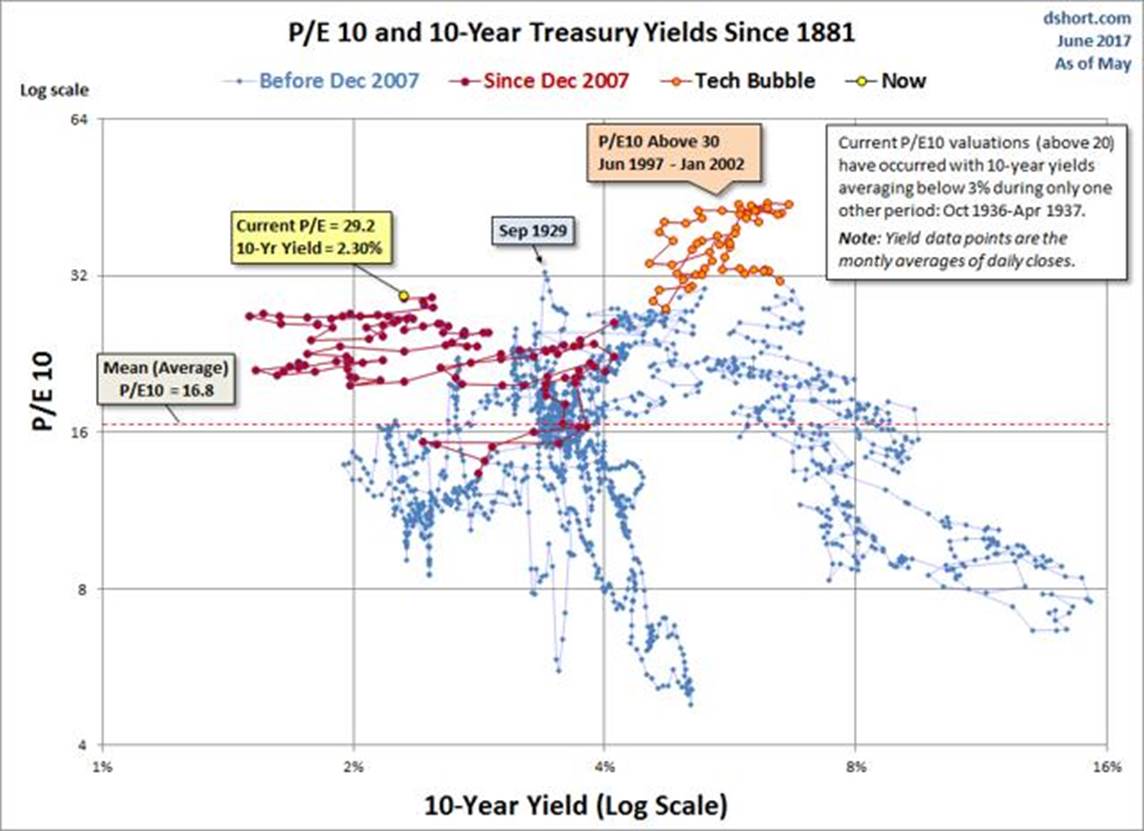
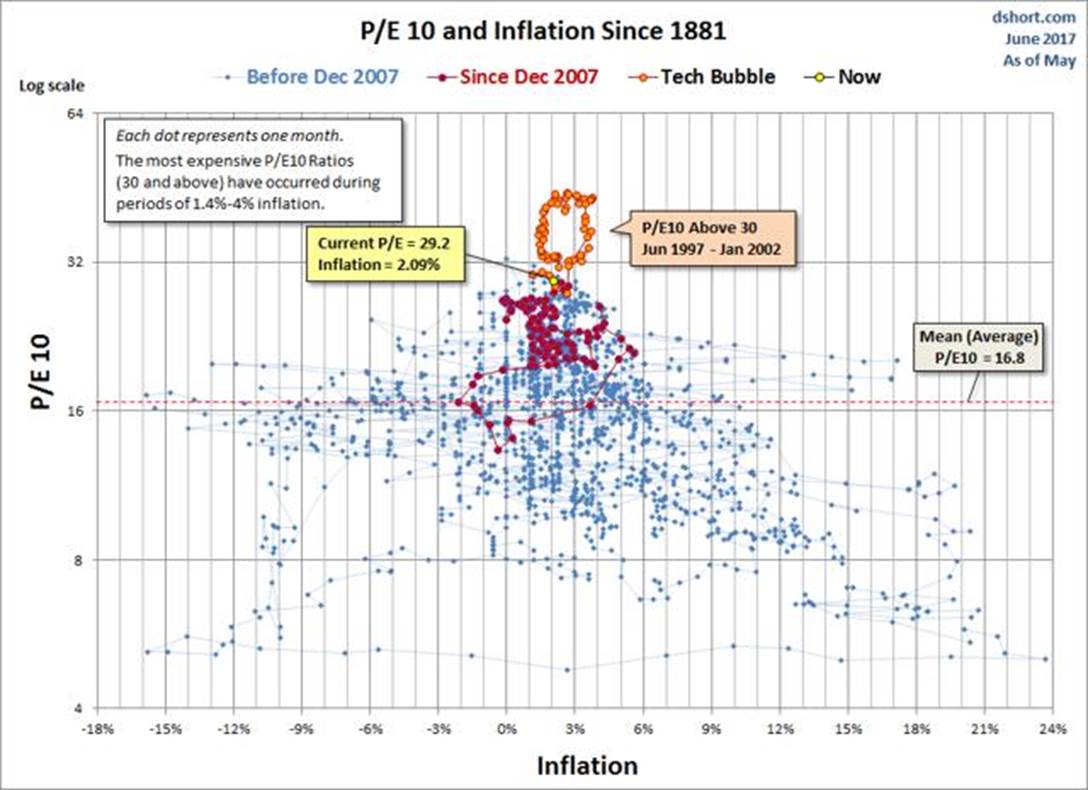
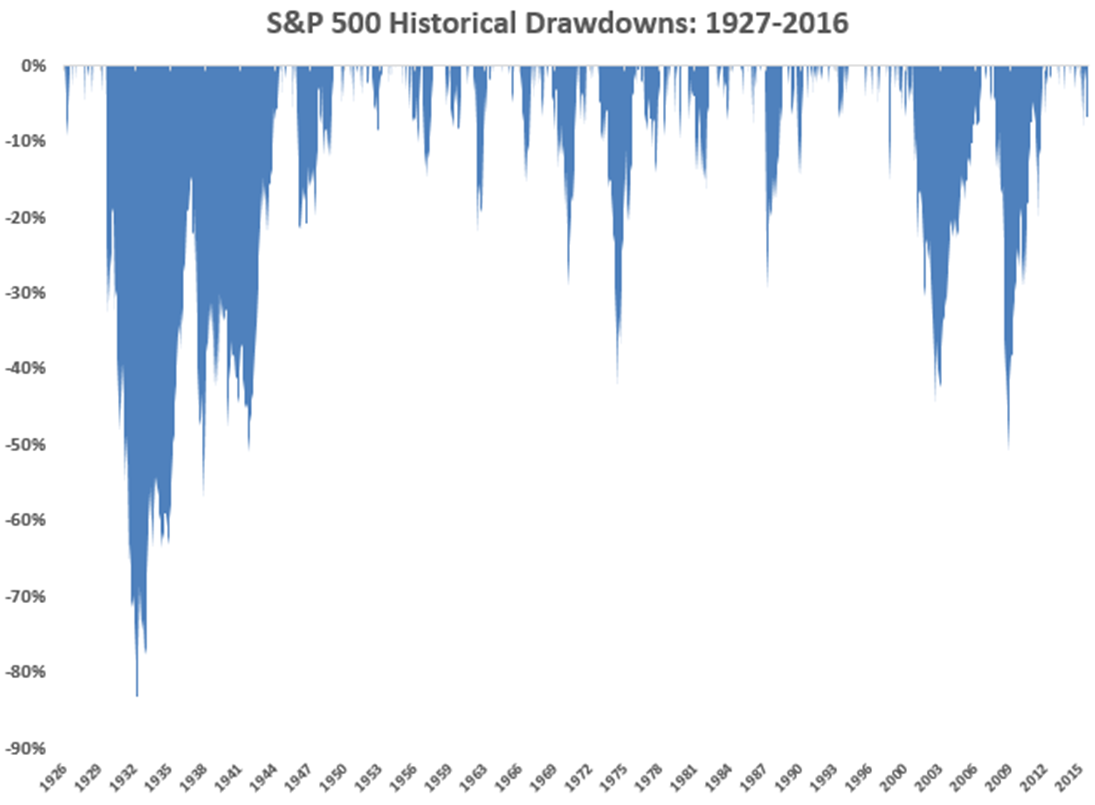
At this point, you can probably tell that I think it is impossible that volatility will remain near record lows forever. So, what is left that, while being improbable, must be the truth? Having spent a lot of time lately thinking about the current state of financial markets, I think the risk that most (but not all) market observers view as improbable is that Central Bankers around the world will lose control of their bond markets. Put another way, I think that most market participants are paying extremely high prices for credit of all types, from Sovereign bonds with negative yields to Investment Grade Corporates (IG) yielding 1% over equivalent sovereigns to High Yield (HY) bonds near (but not quite at) all-time tights, because they think that central banks are infallible. Long-time readers know I have been pointing at these markets as incredibly overvalued (I think the next "big short" will turn out to be European Sovereign bonds with negative yields and High Yield), but so far have been wrong, mainly because the bond market continues to believe, as a whole, that the central bank "put" will always be there. The market is pricing in the fact that it is extremely improbable that rates will ever rise meaningfully again. However, when thinking through the various likely future outcomes for financial markets, one scenario continues to strike me as the most likely: that financial markets swiftly, synchronously sell off - a flash crash across global markets that central bankers are unable to stop before bonds are off 15% and stocks are off more than 20%. When will this happen? Probably not until the ECB or Fed start to meaningfully unwind their $14 trillion in bond holdings. If they never do but continue to "buy buy buy," literally forever, then maybe the bond market will be able to avoid this scenario. But stocks are a different story. Something (and no, I don't know what it will be) will trigger a selloff that lasts more than a few days, and put sellers will have to hedge, and no one will be there to take the other side - and then we'll get a flash crash that morphs into something a little bigger and longer. If stocks have to sell down to levels that make them attractive again to value buyers to find a bid, that could be ugly - see the valuation charts below (thanks to DShort.com for the next three charts).
Yes, we are 99% above the Exponential Regression Trend Line. We've only been higher in 2000, and that was a different type of market.
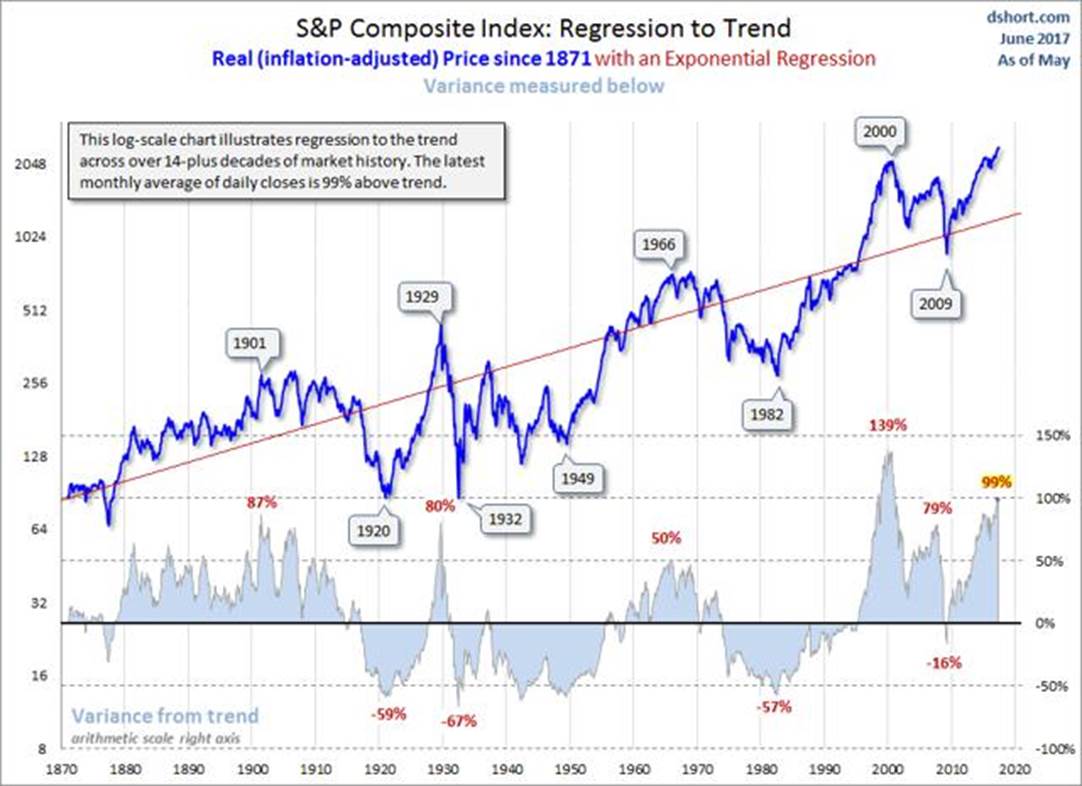
Historically, drawdowns have been severe. We are in the calm before the storm.
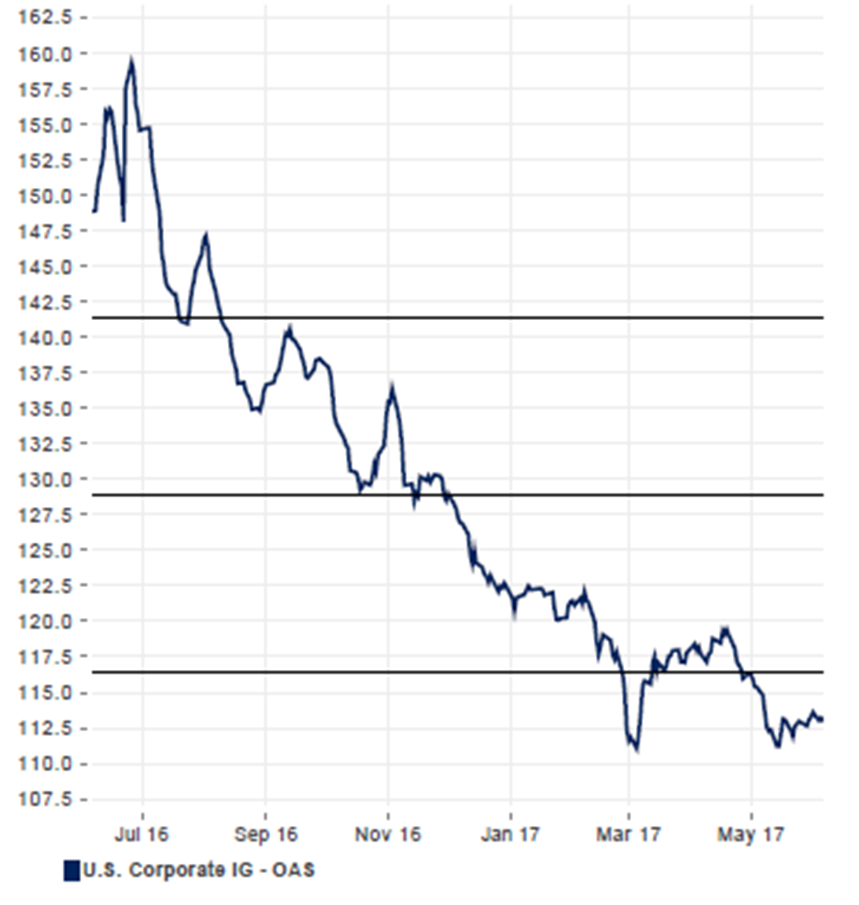
"Safe" Investment Grade Bonds aren't Going to Save You This Tim
Forward Returns for Stocks Will Most Likely Be Quite Low - Chart from Hussman Advisors
So, what's an investor to do? Cash should be your first option. Too many investors view cash as a cost - the lost return on assets you could have been holding that continued to go up. That "cost" always looks highest near the end of a bull market. However, it's a cost that investors should be willing to bear in order to have the ability to buy stocks at attractive prices. Look at the likely forward 12-year returns on the Hussman chart above. Do stocks returning 2% per year look like something you really can't afford to miss?
"The game is afoot." - Arthur Conan Doyle, Adventure of the Abbey Grange
If your fear of missing out on a blow-off stock rally is too great to allow you to sell, then the next best thing to do is take advantage of all the vol sellers out there to take the other side of the trade - be a vol buyer. This has been costly of late - all the smug owners of vol selling funds are looking pretty smart lately, while those who hedge have just been racking up expired premium.
But…that's when you want to buy hedges - when they are cheap, and before you clearly need them. This will allow you to stay long if you have to but protect your downside. I'm not doing the following trade (I'm not capping my gains by selling the lower strike), but the following chart from the FT is indicative of how cheap hedging has become. Take advantage of it.
Quite a few of you have signed up for the more in-depth Miller's Market Matrix, where I delve in-depth into markets and provide specific investment ideas. This week, it will be jam-packed with many more charts I couldn't fit in this letter. The next issue comes out this week. Don't miss it!
This week's Trading Rules: